Exceptions happen everyday: the bigger (and the more distributed) the system, the higher the chances for things to go south.
Most of us already learned the lesson when we idealized architectures and they bit us back in the form of a catastrophic downtime that could have been avoided, maybe by just adding a required timeout or keeping a few best practices for distributed systems in mind: we are now better architects, who understand that failures are an option and we have to build resilient systems that embrace them and work towards mitigating their impact.
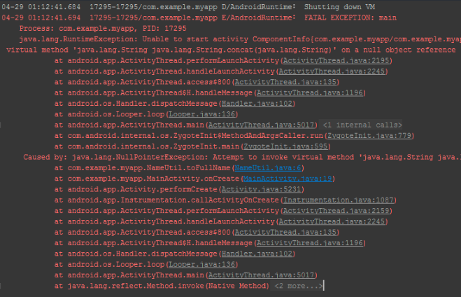
There is one thing, though, that most of us (including me) still suck at: throwing beautiful errors.
We have great infrastructures in place to log information and monitor our systems where, in theory, everything is taken care of; then the day comes when disaster, in the form of a nasty bug, strikes and we’re left trying to understand what’s going on with our software.
How many times, after fixing a bug, you find yourself saying “let’s add some more logs though”? If you’ve been as frustrated as I’ve been, I’d recommend you to read on.
Logging should be transparent to the app
stdout/stderr work alright most of the time, that’s where your app should
log to in 99% of the cases: logging is generally part of the infrastructure,
not the single app, so there’s virtually no reason to make the app aware of a
specific logging transport.
Most logging libraries support std*** out of the box, so that you can, at a higher
level, collect those logs in a single place, without having to change a hundred apps when
you decide to switch to a new log collector (ie. SumoLogic, ELK, Graylog).
Make the app unaware of who’s receiving the logs, it’s the best way to centralize logging and make sure you’re not trapped with one solution unless you change each and every app in your architecture.
Not too much, not too less
Nobody likes to ingest (and pay for) gigabytes of useless logs, especially when you’re trying to debug and all that pops in your monitoring console is:
1 2 3 4 5 6 7 8 | |
So, out of 8 messages we only care about 1 or 2 of them, the actual error
(connection timed out) and maybe the incoming request message (first one above):
most of those messages will not really add anything but clutter, and you’re left
looking at logs that you eventually have to filter out.
A better strategy would probably be to log the error and provide some additional info, in case the reader wants to understand a bit more about the error:
1 2 3 4 5 | |
This should help keeping logs as informative as possible, but it exposes you to a nasty problem, as you’re only logging in case an error occurs. Supposing that your app is an HTTP server, I’d strongly recommend to log the request (very high-level, no need for a lot of details) so that you know that the app is being hit:
1 2 3 4 5 6 | |
else, when a bunch of requests ends up throwing a 500 error and you don’t see
logs in the console, you won’t be able to tell if the problem is with the load
balancer in front of the app that’s rejecting some requests or what. Add cheap
logs at an high level so that you don’t have to make lots of assumption when
things go wrong, so that when you see this in the logs:
1 2 3 4 5 | |
you know the app is probably not receiving traffic at all.
Cluster by identifiers

It’s a good idea to be able to tag logs so that you can cluster them later on, especially if you have a multi-layered architecture: Amazon, for example, launched X-Ray to help in these exact scenarios.
Assign a request ID to each and every request coming to your load balancers, and forward that ID to the inner levels of your architecture: this will help you giving more context to errors.
For example, you might end up seeing that requests that came through the load balancer and hit service A with a particular query string parameter didn’t eventually land on service B, thus you can now focus on understanding why service A is holding on all of the requests with that specific parameter.
What went wrong?
It’s generally helpful to understand what exactly went wrong, or what kind of
parameter we were expecting: most of the times it’s a matter of being able
to include the specific parameter that caused the error in the logs, as there’s
nothing worse than logging a generic invalid parameters error, leaving the
next guy on-call trying to figure out what exactly triggered the error.
Something as easy as:
1 2 3 4 5 6 7 | |
could help you understand the root cause of the failure.
Bear in mind that you have to be very careful when embedding external parameters into your logs, as you might end up logging sensitive information such as DB credentials or credit card numbers: check the documentation of your specific logger to see if it supports redacting information, else you’ll have to manually “hide” those values.
How do I fix this?
Another very important aspects of great logs is the ability to include remediation steps in the logs themselves, so that once a failure happens we’re immediately able to troubleshoot.
As easy as it sounds, it’s not always feasible to include them: for example, when a clients sends the wrong parameter to a service, it’s very easy to identify the root cause, but not so trivial to figure out what needs to be done to remediate the error.
Was there a deployment that changed the
parameter name from userId to user_id? Is the client broken due to an update
on its side? Is it on “our” side or “their” side? No single, clear action can be
taken without digging a bit further, and at that point it’s better to avoid
including vague, unhelpful remediation steps such as “contact the customer as they seem
to be screwing up”, as it might lead you towards the wrong direction.
An example of remediation steps for when a circuit breaker kicks in:
1 2 3 4 5 | |
Most of the time, the breaker will close the circuit for a valid reason; whenever that’s not the case you have a solution right in front of you.
It’s worth noting that remediation steps, like any form of documentation, might get outdated quite fast: my advice is to not get too excited in order to avoid spamming your codebase with instructions that will change every 3 months.
Provide useful info
Most of the loggers available today let you specify some kind of context to surround your log message with: when a timeout connecting to MySQL occurs, for example, it would be nice to understand how your connections pool looked at the time, as well as other information like the timeout itself.
1 2 3 4 5 6 7 8 | |
As usual, no rocket science.
Collect crashes

Last but not least, something that might sound silly to many of you: collect crash reports.
In some languages that’s not as trivial as it sounds (for example, PHP’s fatal errors weren’t catchable until PHP 7), so you might need to look into other, lower-level solutions that are able to intercept and log crashes when userland code can do nothing about it.
NewRelic seems to be the front-runner here, even though its host-based pricing model is quite quirky under certain circumstances (think containers or t2 instances on AWS).
Conclusion
I’ve done quite some damage in the past, so this is more of a collection of friendly advices from someone who banged his head against the wall several times.
If you’re curious about the infrastructure we use to handle monitoring and logging at Namshi let me just give you a brief overview:
- our legacy systems log to Graylog through specialized transports (ie. winston-graylog2)
- the rest of our apps are running in containers and log to
stdout - there’s a container, on each host, that collects all docker logs and ships them to sematext’s logsene
- on staging, we give devs a bit more freedom and let them have a look at the kubernetes’ dashboard
- NewRelic monitors crashes and performance
- Sensu runs checks that ensure things are running smoothly (ie.
ping google.comfrom the machines, check we have at least X products on the website, etc)
If you’d like to read more about logging, I’d recommend this article that really helped me shape this post.
Cheers!