If you’ve worked with Node long enough, chances are you probably grew fed up with the lack of plug-and-play benchmarking and profiling tools in its ecosystem: well, at least for debugging, say no more!
One of the most overlooked features that landed in Node over the past year is enhanced debuggability which, coupled with Chrome’s DevTools, makes it extremely easy to debug and profile server-side JavaScript: it comes with full support of the usual suspects such as breakpoints and CPU profiles, and it’s extremely easy to setup — no external dependency, no overhead, just Chrome.
The trick is very simple, as you just need to launch your node scrips with the
--inspect flag!
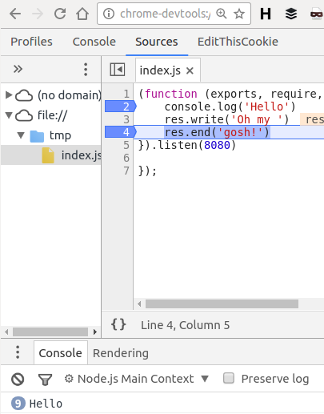
Say you have an HTTP server up & running on port 8080:
1 2 3 4 5 | |
you simply need to start it with node --inspect index.js and head to the URL
pointed out by the command line, something like:
1 2 3 4 5 | |
Needless to say, if you want to pick a specific port, you just need to tweak
the inspect option with something like --inspect=40001.
See you next time!
- At Namshi, most of us develop on remote machines (EC2 in Mumbai) and we only expose a handful of ports from those machines, so we run our debuggers on more “common” ports such as 8090 ↩