Today, after heavily testing performances on a project, I pushed some small but precious changes to the orientdb-odm.
Prelude
Premature optimization is the root of all evil
In these days I was testing performances of a service I am building with OrientDB and the doctrine ODM that we built so far.
Following one of the golden rules for software architects, we didn’t paid attention to performances – at first – but rather went for a design which would allow us to inject behaviours and easily change portions of code (also thanks to the test suite), I knew that I would have noticed huge flaws at performance level when testing it with production data.
A few days ago we committed fetchplans for repository classes, but it wasnt enough: rather then concentrating on which data we should fetch, I realized one major improvement could be applied on how we map data.
The golden rule
When you write a OXM (object-something mapper) you will shortly understand that a huge portion of your job consist into abstract your design, to ease integration of multiple components into your application: repositories, the object manager, POXO, the data mapper, proxy classes and so on.
Of course, abstraction comes with a cost: slow performances, so one of the first things that you do is starting to cache everything.
How we did it
With a single commit
– there’s always room for improvements – the ODM is now able
to hydrate objects 5 times faster: when you hydrate similar
objects from OrientDB (for example, 2 records that share the same
attributes’ values, like is_published or country), there is
no need to duplicate operations, so we added a cached inflector
(with an in-memory / single request cache) and did some other
improvements to the Mapper:
- cached the relations between PHP classes and OrientDB classes (if 2 records of the same OrientDB class are hydrated, there is only one single search operation to find the PHP class that should map them)
- cached the casting of properties (if 2 objects have the same value for the
is_publishedattribute, casting is done once) - cached properties’ annotations (property-level annotations are inspected once per class)
There is no rocket science in what we did, but benchmarks ensure that it’s a huge performance improvement.
By the way, we used Webgrind
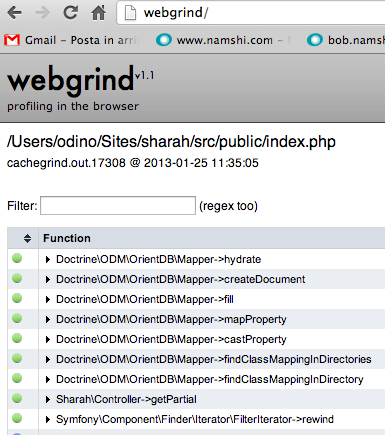
Doing almost all of my work from a Mac, I kind of missed KCacheGrind for profiling, so I was looking for an alternative (no, installing XHPROF isn’t an alternative at 2 in the morning) and I found Webgrind (which is cross-platform), a web profiler that requires zero setup: you basically just need to provide it access from the webserver and, by opening it with a browser, the application automatically launches and parses the cachegrind files generated by XDebug.
Webgrind’s code is a bit of a mess, but then, the result is still pretty good – you get a good overview of the expensiveness of your calls as well as a call graph compiled in DOT, which is a de-facto standard for graph generation.