The idea behind equal web performance is that you should stop looking at metrics other than the 99th percentile: resources shoud be “equally” distributed across all of your clients so that a few clients don’t act as a bottleneck for the others.
Note that during outages, or when you run at “degraded” performance, this is an acceptable practice instead — drop some of the traffic to make sure a good portion of your users are able to use the service, rather than trying to serve more users with nefarious consequences.
Averages
When you measure performances, one of the worst mistakes you can do is to have a look at averages, as they really don’t tell you anything about how your app is performing.
Don’t believe me? Let’s consider this: I have an application with an average response time of ~250ms, over 4 requests. The individual requests recorded these times:
- request A took 5ms
- request B took 5ms
- request C took 5ms
- request D took 1000ms
As you can see, request D will most likely result in an unhappy client, one that has to wait around a second to get a response from our API. If we only look at the average, though, we wouldn’t notice this problem, as ~250ms looks like an acceptable number to us.
Averages will simply give you a rough idea (which, to me, is fairly useless), but won’t be able to tell you whether you’re prioritizing some clients over others, or whether your performance are at an acceptable level for all of your clients — this is why you need to start looking at p50 and p99.
p50
The p50 (otherwise known as median), like the average, is kind of an illusion to me: it tells you that half of your traffic is served within a particular timeframe.
Even though it is definitely acceptable to look at the p50, I still feel this is a very “elitist” metric: what I’m really after is making it great for everyone in the audience, not just half of them.
p99
The 99th percentile is, in my head, kind of like the ultimate metric: I will define a certain number in my head (say 200ms) and think that “I’d be extremely happy if all my traffic was served within that timeframe” — that’s all I look at.
I might sometime get distracted by the p50, but the p99 is really all that matters to me: if the p50 grows from 25 to 100ms I won’t be bothered as much, but if the p99 increases from 100 to 200ms I’d be worried sick about it, as I know it has a larger impact, while the p50’s variation is probably barely noticeable by our clients.
p100
Is a dream: systems fail, networks are unreliable, bugs happen. Consider the p100 utopia, and keep looking at the p99 instead.
Optimizing for the p99
I also generally found out that when you optimize for the p99, you really end up optimizing for everyone: my suggestion is to look at the slowest responses you’re serving and to tackle those first. Since they are the slowest, fixing these will improve your averages as well as help all other transactions execute faster, by removing a slow one that might hog CPU, or memory.
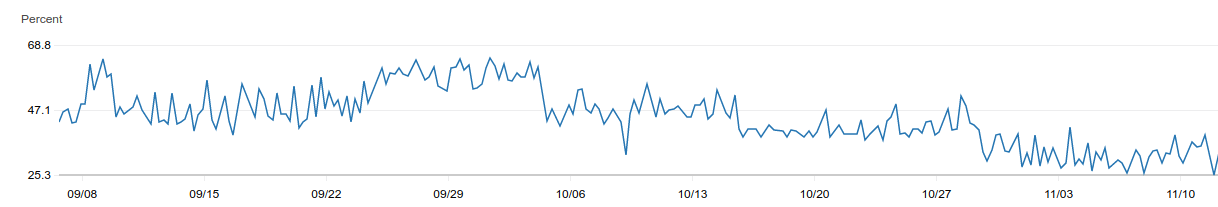
Here are a couple examples of optimizing for the p99 from our work at Namshi — the first is taken from our RDS metrics, and it’s the p99 CPU utilization after optimizing the top queries in our slow query log:
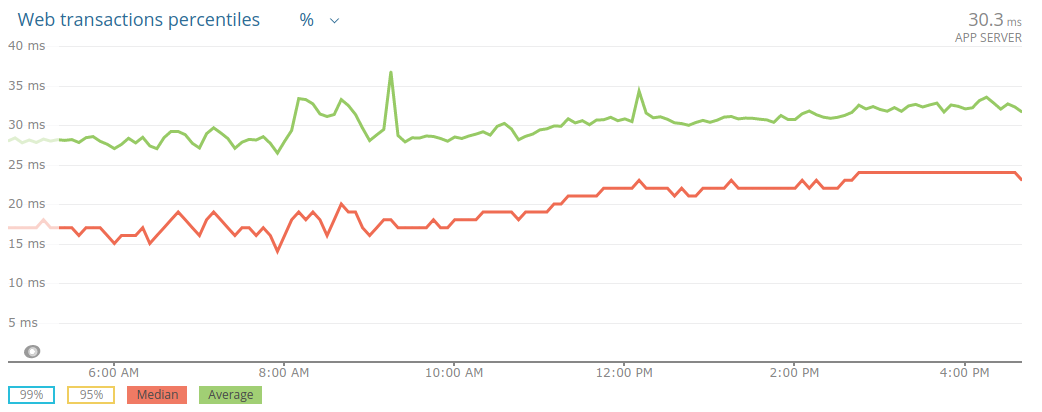
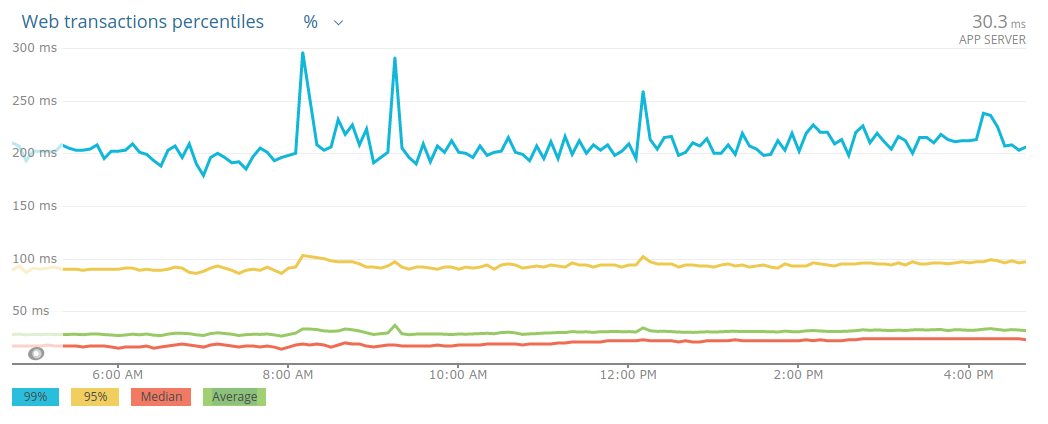
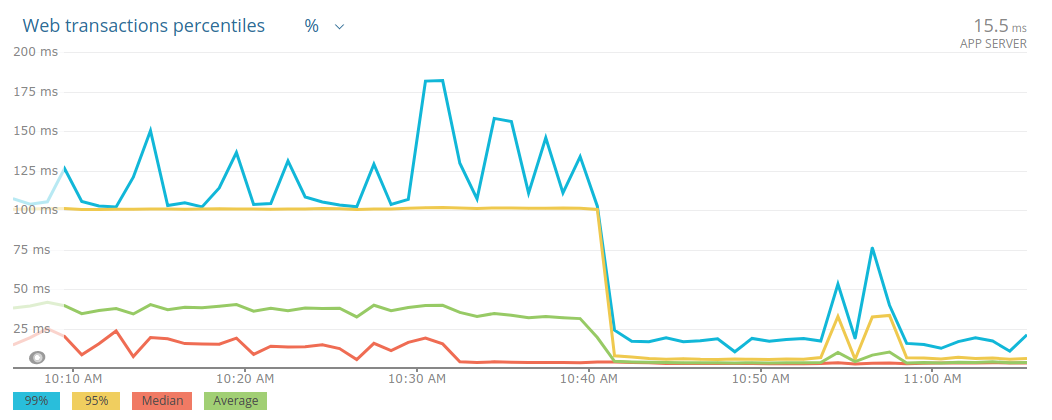
The second one is from NewRelic, and it shows that by removing k8s resource limits (as advised by Zalando) we made apps a lot more reliable (this is super-duper counter-intuitive, I know):
Adios!