In my previous post I briefly spoke about Webgrind, a web-based profiler for PHP: now I’d like to spend some more time giving an overview on how to install and use it, as well as what to look for when profiling an application.
Profiling in a few words
As PHP developers, we are rarely used to profiling: essentially, most of our applications are not bound to extensive CPU usage or insanely huge data-processing operations; the scope of the language is very clear and even though we might need to profile, once in a while, it’s unlikely that we will end up having problems like optimizing MapReduce algorhitms.
But sometimes we do need to profile,
and this will bring on the table bottlenecks of
your applications: within a session of inspection,
you will likely find optimizations that would lead to
a 20/30% faster execution time, by just changing
your backend (PHP) code1.
Why Webgrind
Among all the available profilers for PHP, I choose to go with Webgrind for a bunch of reasons:
- nowadays, I am mostly developing on a Mac2, so KCacheGrind wasn’t an option
- I didn’t want to install XHPROF as it usually takes a few minutes, even though is probably the best profiler for PHP: facebook uses it in production, and it’s able to generate a lot of reports that would make you face performance optimizations from various perspectives
- Webgrind offers a zero-setup installation
Installation with XDebug
XDebug is a must for profiling, as it’s the tool through which we can generate the Cachegrind files, that are basically reports on the costs of your application’s calls.
To enable XDebug’s profiling you will have to
tweak your php.ini’s configuration:
1
| |
Beware that profiling each request your application
processes can be an expensive job (pages that
would usually load in 2/3 seconds can take up to
10 seconds), so you should – instead of enabling
the profiler by default – activate the enable_trigger
directive, which will make XDebug profile your application
only if a specific GET or POST parameter is specified
within the request:
1 2 | |
Dont forget to restart apache once you made the changes:
1
| |
By visiting your application and specifying a special
GET parameter in the URL, you will run your first
profiled PHP response: supposing that you want to
profile the code that runs http://dev.project.com,
just visit http://dev.project.com?XDEBUG_PROFILE=true
Once you’re done with the XDebug configuration, it’s time to install Webgrind:
1 2 3 | |
That’s it!
You can now access Webgrind at
127.0.0.1/webgrind or – if you prefer –
set up a virtual host for it:
1 2 3 4 5 6 7 8 9 10 11 12 | |
and have Webgrind running at
http://webgrind/.
Looking at the results
Once your application runs, XDebug will generate
the cachegrind files that Webgrind will analyze:
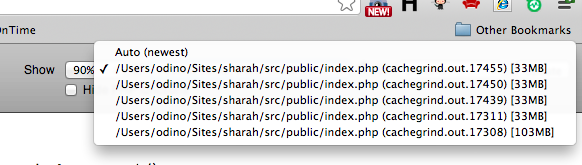
after each PHP response is served from your application,
you can inspect the results from the Webgrind interface,
by just selecting the first file of the list:
it might take some time for Webgrind to generate the
first report, as cachegrind files can easily size up to
100/200 megabytes (files below ~50MB will be read in
10 seconds or so).
When the report is generated, you will see the results: I strongly recommend to generate a report in milliseconds, as it will give you a direct overview on how much time a function takes rather than having this value as a percentage compared to the entire application’s run.

If you order results by Total inclusive cost, you will
exactly see which ones are the most expensive functions
of your applications: in the example, you will see that the
Doctrine\ODM\OrientDB\Mapper::hydrate method really
kills the performances of my application (10.6 seconds).
Having this kind of report is not really useful, as usually you need to dig deeper to understand which exact step is making that function taking all that time: you can investigate further by clicking on a function, action that will open the call stack after that function is called:
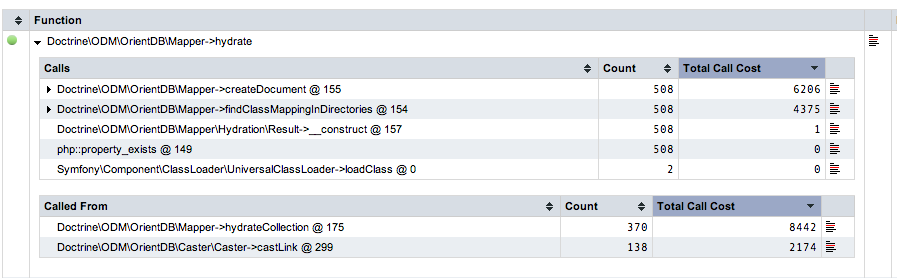
as you see, the problems, here, lies in
Doctrine\ODM\OrientDB\Mapper::createDocument (6.2 seconds)
and Doctrine\ODM\OrientDB\Mapper::findClassMappingInDirectories
(4.3 seconds), so there you have the explanation why
Doctrine\ODM\OrientDB\Mapper::hydrate takes more than
10 seconds.
Then, take your time to investigate even further and make the optimal changes in your application, run it with the profiler enabled once more and have a look at the results:
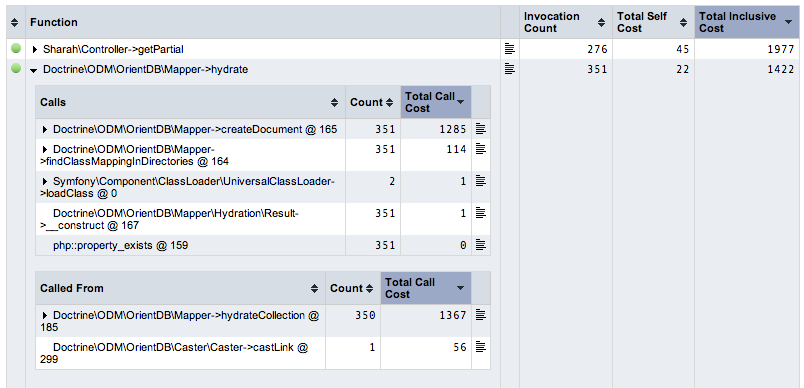
As you see, after I tweaked my code,
Doctrine\ODM\OrientDB\Mapper::hydrate is not even the
most expensive function at all (Sharah\Controller::getPartial is),
and the previously performance-killer methods, which
would take ~6 and ~4 seconds, are now respectively
taking ~1 and ~0.1 seconds.
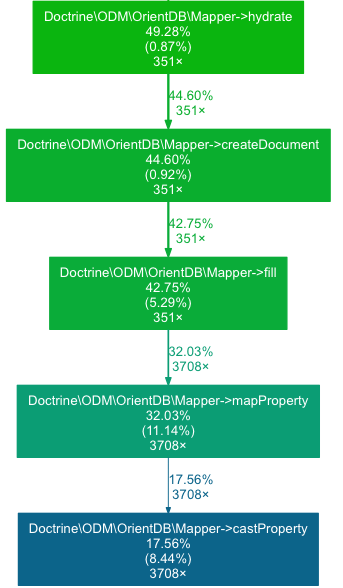
The call graph
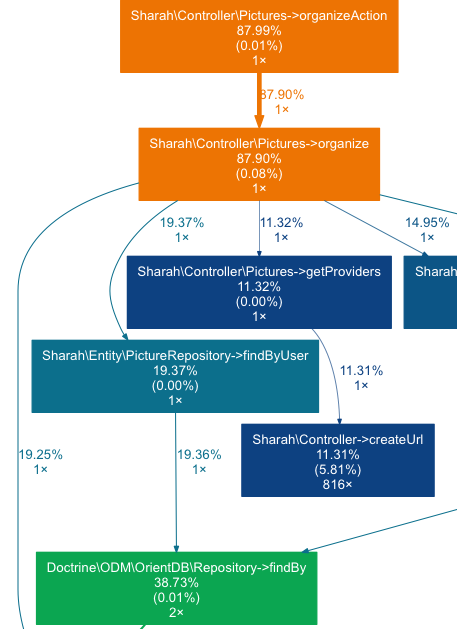
Another interesting feature of Webgrind3 is the ability to generate a call graph to visualize bottlenecks in the application: by having a look at the graph you will have a top-down overview on how much execution time (expressed in percentage) a function will take.
When you look at it, you should question every step of the graph and ask yourself is that specific function should really take that amount of time.
For example:
- if a controller takes
20%of the time to run (calledTTRfrom now on), it might be that you have a design flaw, as it should be the most expensive part of your application, calling the models and rendering the view (which are included in the calculatedTTR) - if a model’s method is taking
60% TTR, there is a bad smell: how come that just retrieving data once is taking more than half of theTTR? - if bootstrapping the application takes
15% TTR, then it’s fine, as that is usually the time a well-abstracted framework needs to provide you a solid foundation to develop on top of
In the image above, you will see that 87%
of the execution time is taken by the controller’s
action (which is fine) and then equally
distributed (10/20%) across various other
functions that controller calls.
Conclusions
This is not an extensive guide on profiling, neither a fair comparison of PHP profilers (as I said, I picked Webgrind, last night, more because of the stress-free installation rather than its actual capabilities4), but I hope it can give you a good quickstart guide to start optimizing bottlenecks in your applications.
One thing that I would really like to point out is to stop useless optimizations: there is no need to “drop double quotes in favour of single quotes” because those are such small optimizations that you will never feel in your application; create useful benchmarks and always question your choices: running a solid benchmark and profiling your application properly will also tell you that sometimes the best design is probably unpractical to perform really well.